
Who Are The Elderly Caregivers? A 2025 Reality Check
- Aug 22, 2025
- 16 min read

Are You Seeing Scary Signs of Aging in Your Loved One?
The Summer is often a time of joy and family reunions, but for many Generation Xers and Millennials, it can also be a moment of realization—the recognition that their aging parents(s) or loved ones may soon require more support than anticipated. Imagine yourself going home for vacation, expecting the usual warmth and comfort, only to discover subtle but significant changes.
You notice the house, once meticulously kept, now slightly in disrepair, or cluttered in a way that’s uncharacteristic of your family member. Perhaps it’s the physical decline—slower movements, a struggle to keep up with conversations, or a hint of confusion in tasks that were once routine. Maybe it's their personal care that seems to be slipping—soiled clothes and not so fresh hygiene.
Not every observation calls for an immediate fix, but they plant a seed: Is it time to bring this up? Do we need a family huddle? That’s the quiet pivot when a son, daughter, or friend begins to see themselves as the primary caregiver.
There are only four kins of people in the world: those who have been caregivers, those who are currently caregivers, those who will be caregivers, and those who will need caregivers.
~ Rosalynn Carter’s Observation on Family Caregivers[1]
The ripple goes beyond the kitchen table. Employers are facing a new wave of eldercare demands—much like the childcare reckoning of years past. The question is no longer “if” but “how fast” workplaces will adapt with practical supports for staff caring for aging relatives and extended family.
Clinicians feel this, too. Family caregivers are the most consistent eyes and ears—knowing history, routines, and what a good day looks like. Their insights shape patient-centered goals of care. A quick review of this snapshot shows what informal caregivers juggle, prompting earlier connections to community resources so care plans succeed in real life.
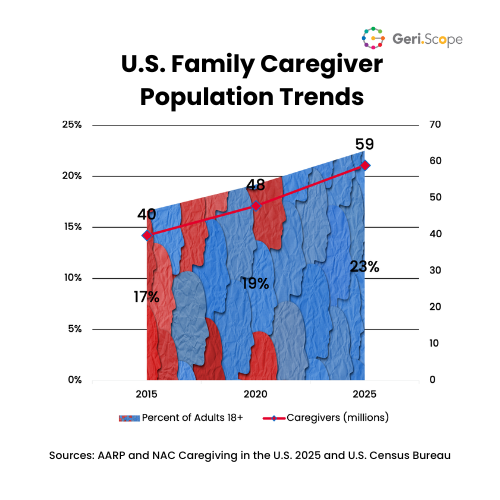
In all cases, the need for awareness, planning, and action is clear as the number of caregivers in the U.S. continues to grow from an estimated 40 million, or 17% of the adult population in 2015, to 59 million, or 23% of the population in 2025 (See Figure 1).[2] For reference in 2025, just 4 in 10 seniors had a plan for their care and only 47% of caregivers have a plan for their long-term care.[3] That’s why planning is key because it’s not a question of “if,” but “when” you may find yourself in the role of an elderly caregiver.
The data paints a clear picture: as we progress through the 21st century, the responsibility of caregiving is shifting increasingly towards the younger generations. Here’s a comparison of generation ages and population distribution figures from the U.S. Census Bureau.[4]
|
|
| 2024 | ||
Generation | Birth Years | Births | Age | Population | % |
WWII | 1922 to 1927 | 98+ | 233,705 | 0% | |
Silent Generation | 1928 to 1945 | 46,782,000 | 80 to 97 | 13,507,925 | 5% |
Baby Boomers | 1946 to 1964 | 75,821,844 | 61 to 79 | 64,448,248 | 24% |
Generation X | 1965 to 1980 | 54,910,604 | 45 to 60 | 65,432,121 | 25% |
Millennials | 1981 to 1996 | 61,973,042 | 29 to 44 | 74,103,152 | 28% |
Generation Z | 1997 to 2012 | 65,094,652 | 13 to 28 | 49,252,083 | 18% |
|
|
| Total | 266,977,234 | 100% |
Ultimately, the observations you make during vacation visits are more than just passing concerns; they are early indicators of a looming reality that will require your attention and proactive measures.
What Does Your Family Caregiving Future Look Like?
From a personal perspective, it's valuable to recognize where you fit in the generational continuum.
To Which Generation Do You and Your Loved One Belong?
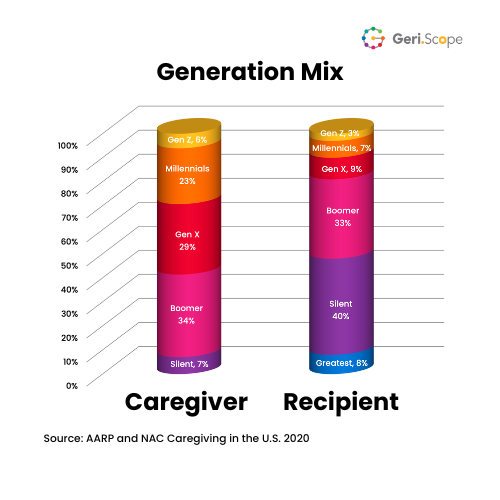
Generations are more than just labels; they represent distinct groups shaped by specific life experiences and societal changes. Identifying generational start and end points, as well as perspectives allows you—both the caregiver and recipient—to make better connections and align expectations beyond the pure statistics illustrated in Figure 2.[5]
World War II Generation (1922-1927): A culture of sacrifice, duty, and collective action that rebuilt institutions and prize stability and service.
Silent Generation (Born 1928-1945): Quiet strivers who value loyalty, craftsmanship, and keeping systems running without fanfare.
Baby Boomers (Born 1946-1964): Change-minded institution-builders who pursued upward mobility and reshaped culture around personal choice.
Generation X (Born 1965-1980): Skeptical, self-reliant pragmatists who prize authenticity and flexibility, bridging analog and digital worlds.
Millennials (Born 1981-1996): Collaboration-oriented, purpose-driven adopters of the social web who blur lines between work, life, and community.
Generation Z (Born 1997-2012): Creator-led, hyperconnected realists who center diversity, mental health, and pragmatic activism.
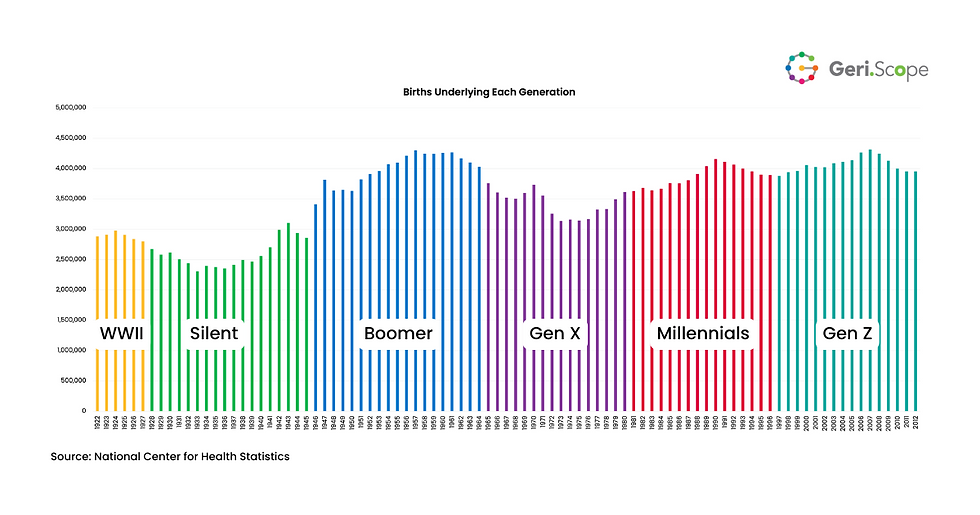
This chart illustrates the size of each generation by birth year from 1922 to 2012 according to the National Center for Health Statistics. Not sure to which generation you or your loved one belongs, use your birth year to identify your generation in Figure 3.[6]
How Does Today's Population Landscape Shape Our Caregiving Roles?
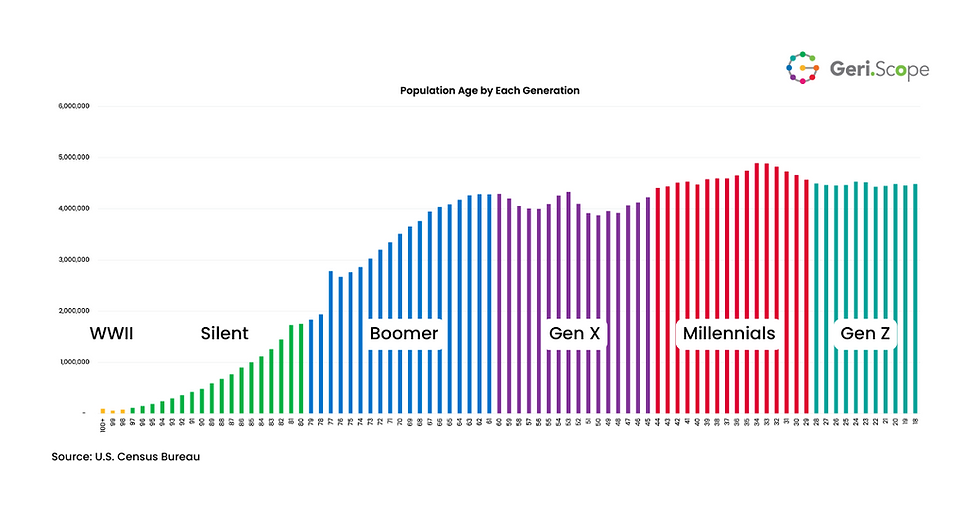
To give you a clearer appreciation, let’s delve into the population dynamics as of 2024 diagrammed in Figure 4:[7]
WWII Generation: Now 98 years of age or older, they represent a small but significant group of frail elders that need meaningful support.
Silent Generation: This group, now aged between 80 to 97, declined to just 5% of adults over the age of 18 and they are entering the period of greatest care needs.
Baby Boomers: Representing the largest surge in our aging demographic, Boomers are currently 61 to 79 years old, with 11,400 celebrating their 65th birthday each day.[8]
Generation X: Gen Xers are between 45 to 60 years old and in their peak income earning years when they have to make choices between career and caregiving.
Millennials: With an age range from 29 to 44 years old, Millennials are the meat of the “Sandwich Generation,” juggling kids, career, and family caregiving.
Generation Z: The youngest of our current caregivers, with an age range from 13 to 28 years old, Gen Z often supports grandparents of a loved one with serious or terminal illness.
Whether you’re currently a caregiver or preparing for a future caregiving role, GeriScope resources are here to help. Remember, planning for caregiving is not just about anticipating needs; it’s about recognizing the impact across generations and creating a supportive environment for those who give and receive care.
Are You a Sandwich Generation Member?
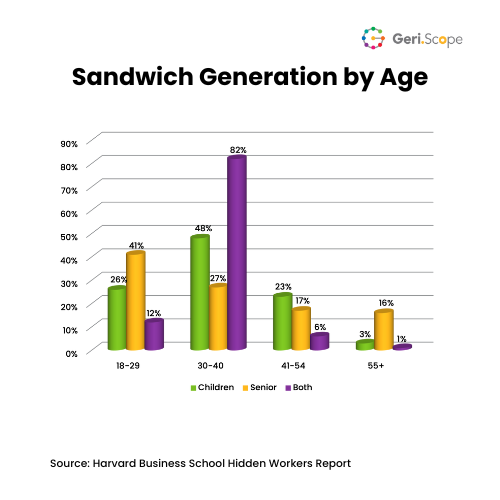
The demographic shift in the United States towards an older, age-dependent population has big implications for those caring for both children and seniors as charted in Figure 5, with an estimated 82% of people between 30 and 40 years of age likely members of the sandwich generation.[9]
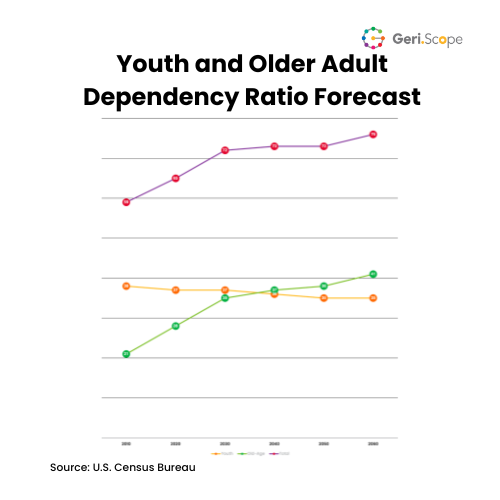
Evaluation of changes in the youth and old age dependency ratios by the U.S. Census Bureau highlights the growing demand to support an aging population while also caring for children that contributes to a larger number of adults in the “Sandwich Generation.” Figure 6 maps how the overall dependency ratio is forecast to rise from a low of 59 in 2010 to a projected high of 76 by 2060.[10]
Alongside 17 million sandwich-generation adults, an estimated 4 million teenagers—and possibly up to 5.4 million caregiving youth[11]—are stepping in when affordable in-home care is out of reach. Their support spans activities of daily living (dressing, eating, mobility), translating at medical appointments, and taking on a larger share of housework.
What’s the Youth Dependency Ratio Trend?
The number of children under 18 for every 100 working-age adults (aged 18 to 64) is projected to decrease from a historical high of 65 in 1960 to a projected 35 in 2060. In other words, by 2060, there will be just over one child for every three working-age adults, a decline from the 1960 ratio of two children for every three working-age adults.
What’s the Old-Age Dependency Ratio Forecast?
In contrast, the old-age dependency ratio, which indicates the number of people aged 65 and older for every 100 working-age adults, is projected to nearly double from 21 to 41 between 2010 and 2060. This means that by 2060, there will be approximately two-and-a-half working-age adults for every older person eligible for Social Security, compared to three-and-a-half in 2020.
What Do The Dependency Ratio Shifts Mean to Americans?
Social Security. The increasing old-age dependency ratio suggests a growing burden on the Social Security system. As more people become eligible for Social Security benefits, fewer working-age adults will be contributing to the system. This could strain the Social Security fund, potentially contributing to challenges in maintaining current benefit levels without adjustments to the system.
Healthcare Demands. The rise in the old-age dependency ratio will likely boost demand for services, particularly those related to age-related conditions. This could put additional strain on healthcare systems, necessitating greater funding, more medical professionals specializing in geriatric care, and expanded long-term care facilities.
Economic Impact. With a higher proportion of the population being elderly, there may be a decrease in the overall workforce size, potentially impacting economic growth. This could cause labor shortages in certain sectors and require adaptations in workplace policies and practices to accommodate an aging workforce. There might also be a shift in the types of goods and services in demand, with more focus on products and services tailored to older adults.
In summary, the shift towards an older, age-dependent population in the United States poses challenges and necessitates strategic planning in social security, healthcare, economic policies, and support systems for both the elderly and their caregivers. It highlights the need for proactive measures by relatives and employees to prepare for the changing demographic realities.
Who Are The Elderly Recipients of Care?
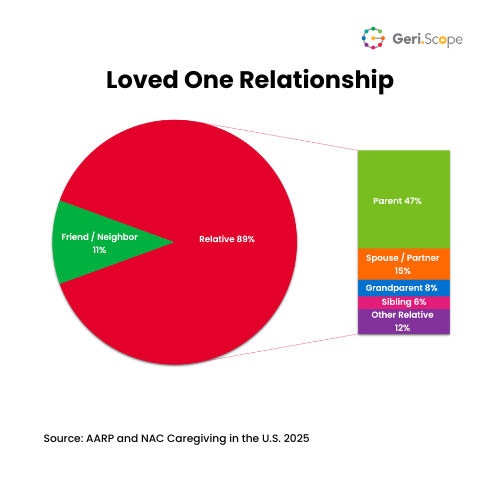
Caregivers in the U.S. are indispensable because the help is personal—most support relatives (89%), and the rest step in for close friends or neighbors (11%), as depicted in Figure 7.[12]
To estimate how many people receive that care, we applied AARP’s distribution—76% of caregivers help one person, 20% help two, and 4% help three or more[13]—to the 59 million caregivers in 2025, yielding roughly 77 million recipients. That total equals about 63% of the 123 million Americans age 50+ in 2024—clear evidence of how widespread older adult care has become. These caregivers, provide support for everything from handling insurance claims and covering out-of-pocket costs to critical emotional support during trips to the Emergency Room (ER). Their presence offers comfort and a sense of normalcy to those in their care.
What Types of Care Do Informal Caregivers Provide?
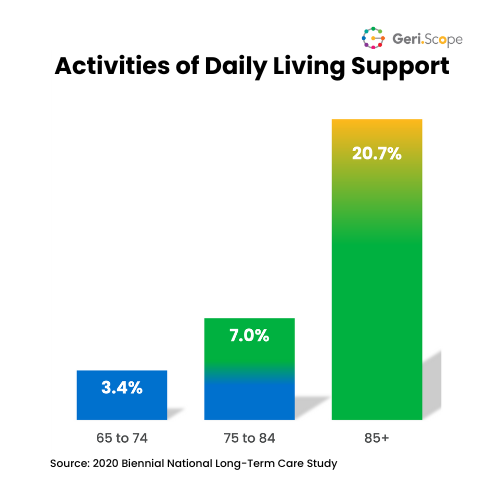
Elderly caregivers perform a wide range of activities that vary in complexity, physical demands, and time commitment. In terms of daily support, family caregivers make meaningful contributions to completing activities of daily living (ADLs), aiding with skills like bathing, dressing, and feeding. This personal care is an integral part of the support system for those with chronic conditions and serious illnesses that need daily support on a long-term basis. On average, caregivers assist with 1.9 of the six ADLs;[14] many focusing on toileting (45%) and continence (65%).[15] Not surprisingly, the percentage of older adults requiring help with ADLs increases with age as shown in Figure 8.[16]

The family caregiving journey often starts with taking on Instrumental Activities of Daily Living (IADLs) such as handling finances and using communication tools (phone, email, etc.). Generally, these life management skills require higher-level thinking and cognition for planning and completing multiple steps, as well as physical capability. On average, families help perform or have complete responsibility for an average of 4.5 of the eight IADLs (Figure 9).[17] Note, this in an increase from a 4.2 average in 2015.[18] The most frequently done IADLs in 2025 include shopping (81%), arranging transportation (79%), doing housework (77%), and preparing meals (67%).
Additionally, informal caregivers not only aid with medication management and completing nursing duties, but they also accompany loved ones on medical appointments, speak up for their needs with social services, and ensure both patient and caregiver voices are heard in a wide range of healthcare settings. This person-centered advocacy is particularly important in navigating the complex healthcare system and making informed decisions about treatment options.
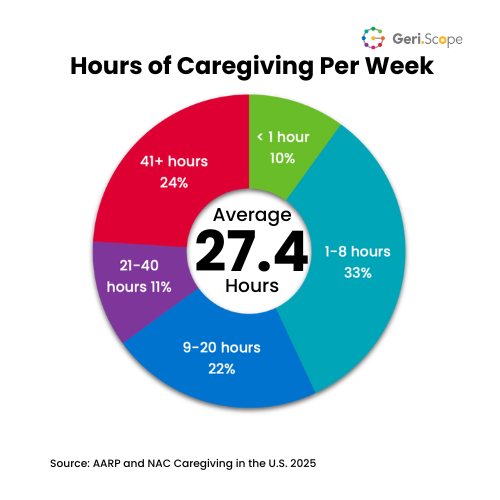
Expect the time demand to grow as your loved one’s needs get more complex. What begins as occasional check-ins (sometimes under an hour a week) can turn into a daily commitment. On average, caregivers spend about 27 hours a week; one-third give more than 20, and roughly a quarter exceed 40—essentially full-time as highlighted in Figure 10. Women are also more likely to provide “constant care”—near round-the-clock support—(22% vs. 16% of men).[19]
Who Carries the Weight of Family Caregiving?
As you navigate informal caregiving, expect it to reshape your personal life—and plan for it. The average caregiver age has risen from 49.5 (2015) to 50.6 (2025),[20] a signal to adults approaching midlife to prepare for this role before it is forced on you unexpectedly (see Figure 11).

Care often centers on the oldest adults. The average care recipient age remains 70,[21] with nearly half supporting loved ones over the age of 75 (Figure 11). Who you help also shifts with your age: older caregivers are more likely to care for spouses/partners and siblings (often peers), while younger caregivers more often support parents or grandparents (an older generation).
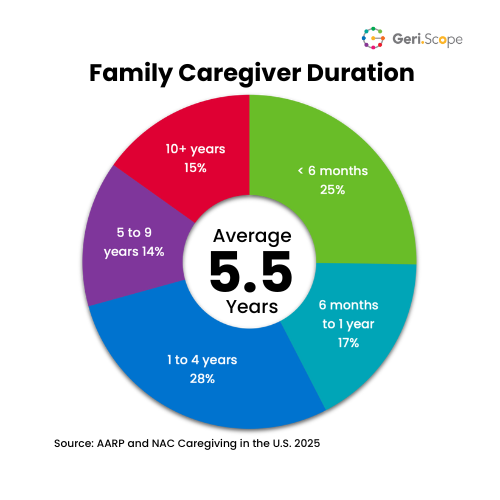
Further, the average duration of caregiving has extended from 4.0 years in 2015 to 5.5 years today as spotlighted in Figure 12,[22] with an increasing percentage providing care for ten years or longer. This extended period of caregiving is often due to the recipients living longer with chronic illnesses or cognitive impairments, adding long-term burdens on caregivers.
The landscape of informal caregiving in the United States reveals a noteworthy gender disparity, with women shouldering most caregiving responsibilities. Since 2015, an estimated 61% of all family caregivers were women[23] that are often balancing the demands of their own lives with the extensive needs of aging or ill family members. They typically manage not just the physical aspects of caregiving, such as getting in and out of bed and a chair or housekeeping, but also the emotional and administrative activities involved in coordinating appointments and providing companionship. This unaccounted-for labor profoundly impacts on their personal and professional lives, with many facing challenges in maintaining work-life balance.
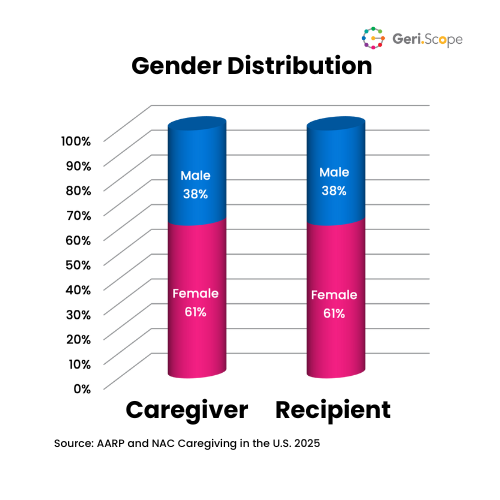
Across the last decade, the gender balance has held steady—61% female, 39% male (Figure 13)[24]—for both caregivers and those receiving care. Women’s higher share among recipients likely reflects longer life expectancy, a greater likelihood of widowhood and living alone, higher disability rates at advanced ages, and historically lower lifetime earnings—factors that combine to increase the need for support.
Regardless, it's important to recognize that an increasing number of men are stepping up to shoulder this burden. It’s a positive development, reflecting changing societal norms around gender and care responsibilities. Men are taking on tasks that range from nursing care to emotional support, challenging the traditional perceptions of male roles.
Men’s involvement in caregiving not only helps distribute the burden more equally but also brings diverse perspectives and strengths to the caregiving journey. It's a movement toward a more inclusive approach to what it means to be a caregiver, recognizing that the responsibility and the ability to care deeply for others are not confined to women alone.
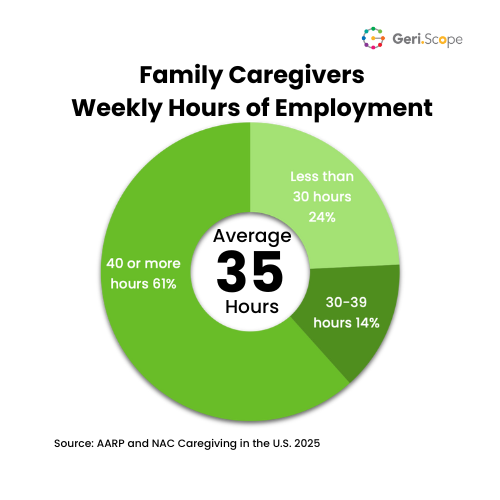
Recognizing the contributions of husbands, wives, sisters, brothers, daughters, sons, partners, and friends is essential to seeing the full scope of informal caregiving—and to building the supports these helpers need. In 2025, 70% of working-age caregivers (18–64) were employed while providing care; when including those 65+ who still work, the share is 60%. Since 2015, employed caregivers have averaged a little over 35 paid hours per week (Figure 14).[25]
Employment patterns differ by gender and job type. Among employed caregivers, 53% are paid hourly and 40% are salaried; women are more often hourly (55%) than men (47%). Men are more likely to be employed while caregiving (67% vs. 58% for women) and, on average, log more weekly work hours (38.7 vs. 33.5). For clinicians and employers, these realities underscore the need to account for work schedules and connect caregivers to available community resources so care plans succeed in real life.[26]
How Informal Caregiving Helps the U.S. Healthcare System.
Unpaid family care is a cornerstone of American health—$2.5 trillion in 2025, up from $1 trillion in 2015 as diagramed in Figure 15—yet even that understates the impact because it excludes out-of-pocket costs, lost wages, and depleted savings.
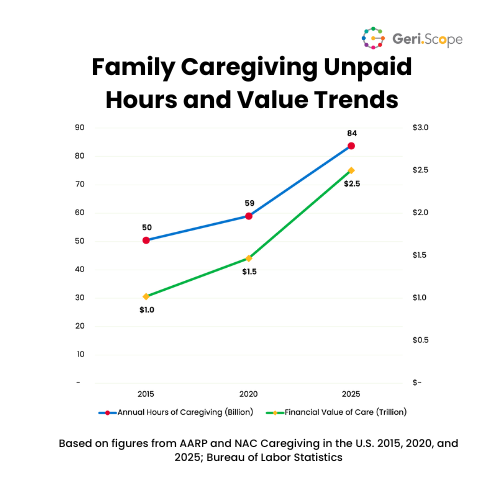
How we derived the national value: 59 million caregivers in 2025 providing an average of 27.4 hours/week equals about 84 billion hours annually. Using median U.S. wages ($20.83 in 2015; $24.90 in 2020; $29.90 in 2025) and multiplying hours by rates yields the estimated increase from $1T (2015) to $2.5T (2025).
For scale, Medicare and Medicaid together spent $359.1B in 2023[27] on freestanding home health, nursing homes, and continuing care retirement communities, with additional costs covered by private insurance and families. Set against those line items, the value of unpaid care shows up as the essential—if largely invisible—system that keeps older adults living where they want and care plans viable.
On a personal level, about 27 hours a week at an average wage of $30 translates to roughly $43,000 of care value each year from a single caregiver.
How Will Caregiving Affect You Physically, Emotionally, and Financially?
Family caregivers face numerous emotional, physical, and financial burdens and challenges in their caregiving roles. These burdens have profound impacts on their health, well-being, and overall quality of life. Here’s a snapshot of how elderly caregiver’s rate their experience from “good” to “bad” in each of these areas. Each percentage in Figure 16 represents the average response over that last decade from 2015 through 2025.[27]

What Physical Challenges Await You?
Since 2015, nearly 50% of family caregivers reported experiencing physical strain resulting from these activities.[29] Physical impacts can take many forms such as:
Physical Pain. Caregiving often involves physically demanding work, such as lifting or helping the care recipient with mobility. This adds to physical strain and injuries, including chronic pain or musculoskeletal problems.
Exhaustion. The continuous nature of caregiving, especially when it involves round-the-clock care, contributes to exhaustion. Caregivers might experience fatigue, sleep disturbances, and a decline in their own physical condition.
Neglect of Personal Health. Caregivers often prioritize the issues of the person they are caring for over their own, leading to neglect of their physical health. This might result in skipping medical appointments, not maintaining a balanced diet, or not getting enough exercise. Today, one in five report their health is fair or poor, up from just 17% in 2015.[30]
How Does Informal Caregiving Impact Emotional and Mental Well Being?
While caring for an elderly loved one can lead to a sense of fulfillment and meaning, it also contributes to negative impacts on emotional and mental well being.
Stress and Anxiety. Managing the complex needs of another person, coupled with the fear of making mistakes or the uncertainty of the care recipient's health, add to high levels of stress and anxiety. Over the last decade, 84% of family caregivers reported their responsibilities were somewhat to highly stressful.[31]
Emotional Exhaustion. The emotional intensity of caregiving, especially in the case of chronic or terminal illnesses, may cause feelings of sadness, hopelessness, and emotional exhaustion.
Role Strain. Many caregivers struggle to balance their caregiving responsibilities with other roles – parenting, working, or maintaining relationships. This role strain injects feelings of guilt and inadequacy.
Social Isolation. Caregivers often find themselves isolated from social interactions and support networks due to the time and energy demands of caregiving. For example, a growing number of family caregivers report feeling alone at 24% in the 2025 report, a five percent increase from 19% in 2015.[32]
Depression. The combined effect of physical, emotional, and financial burdens may be a factor in depression, impacting their ability to provide care and manage their own lives.
What Are The Real Financial Impacts of Caregiving
Even with social service support and insurance, most families find there aren’t enough resources to cover 100% of their loved one’s 24-hour care needs, leaving a gap to be filled by family and friends. In fact, nearly 40% of family caregivers report experiencing financial strain as a result of supporting elderly loved ones. Some of the biggest impacts:[33]
31% stopped saving up from 28% in 2020
24% used up personal a 2% increase from 2020
23% took on more debt
20% left bills unpaid or paid late
So, your family caregiving role is not only fundamental in ensuring the health and wellbeing of an aging relative but also foundational in reducing the financial burden on the formal healthcare system.
These challenges highlight the need for support systems and resources for informal caregivers. It's essential that they have access to physical, emotional, and financial assistance to manage these burdens effectively. Recognizing the importance of caregiver health and well-being is central in ensuring that both caregivers and those they care for maintain the highest possible quality of life.
What To Do Next
If those summer visit “uh-oh” moments rang true, name what you’re seeing and map it using three lenses: How You Help (ADLs/IADLs, nursing, emotional support), Who You Help (relationship, age, living situation), and What’s on Your Plate (work, kids, distance, hours). That snapshot turns worry into a plan.
Bring it to your clinician so care aligns with real life—family caregivers spend regular time with loved ones and can flag changes and goals a short visit may miss. Share it with your employer, too: most caregivers also work, and awareness opens doors to flexibility and support.
GeriScope’s Family Caregiving Snapshot and Guides are built to make this easier—clear steps, not platitudes. Download the Guides, subscribe for updates, and pass the Snapshot to family, your care team, and your manager. Care goes better when everyone’s looking at the same picture—start with yours.
Article References and Sources:
[1] The Rosalynn Carter Institute for Caregivers, https://rosalynncarter.org/.
[2] Caregiving in the U.S. 2015, 2020, and 2025 Reports, AARP and NAC.
[3] AARP & National Alliance for Caregiving (NAC), Caregiving in the US Research Report July 2025, July 24, 2025, https://www.aarp.org/content/dam/aarp/ppi/topics/ltss/family-caregiving/caregiving-in-us-2025.doi.10.26419-2fppi.00373.001.pdf.
[4] National Population by Characteristics: 2020-2024, June 2025, https://www.census.gov/data/tables/time-series/demo/popest/2020s-national-detail.html.
[5] Caregiving in the U.S. 2025, AARP and NAC.
[6] National Center for Health Statistics, Birth Data, https://www.cdc.gov/nchs/nvss/births.htm.
[7] National Population by Characteristics.
[8] The U.S. Has Reached the Peak of Peak 65. It’s Time to Apply Readiness Lessons from the Boomer Experience, Alliance for Lifetime Income, January 28, 2025, https://www.prnewswire.com/news-releases/the-us-has-reached-the-peak-of-peak-65-its-time-to-apply-retirement-readiness-lessons-from-the-boomer-experience-302360086.html.
[9] Fuller, Joseph B., Manjari Raman, and Francis Hinterman, Hidden Workers: The Case for Caregivers, Accenture and Harvard Business School, October 2024, https://www.hbs.edu/managing-the-future-of-work/Documents/research/Hidden%20Workers%20The%20Case%20for%20Caregivers%20100324.pdf
[10] Jonathan Vespa, Lauren Medina, and David M. Armstrong, Demographic Turning Points for the United States: Population Projections for 2020 to 2060, U.S. Census Bureau, February 2020, https://www.census.gov/content/dam/Census/library/publications/2020/demo/p25-1144.pdf
[11] Caregiving Youth Research Collaborative, October 2023, Report on Caregiving Youth in the U.S.: Progress and Opportunity [White Paper] https://aacy.org/wp-content/uploads/2023/12/CY-White-Paper_Final-.pdf.
[12] Caregiving in the U.S. 2025, AARP and NAC.
[13] Caregiving in the U.S. 2025, AARP and NAC.
[14] Caregiving in the U.S. 2025, AARP and NAC.
[15] Caregiving in the U.S. 2025, AARP and NAC.
[16] Biennial Overview of Post-acute and Long-term Care in the United States: Data from the National Post-acute and Long-term Care Study, April 21, 2025, https://data.cdc.gov/National-Center-for-Health-Statistics/Biennial-Overview-of-Post-acute-and-Long-term-Care/wibz-pb5q/about_data.
[17] Caregiving in the U.S. 2025, AARP and NAC.
[18] AARP and NAC, Caregiving in the U.S. 2015 Report, June 4, 2015, https://www.aarp.org/content/dam/aarp/ppi/2015/caregiving-in-the-united-states-2015-report-revised.pdf.
[19] Caregiving in the U.S. 2025, AARP and NAC.
[20] Caregiving in the U.S. 2025, AARP and NAC.
[21] Caregiving in the U.S. 2025, AARP and NAC.
[22] Caregiving in the U.S. 2015 and 2025, AARP and NAC.
[23] AARP & NAC, Caregiving in the U.S. 2020 Report, May 14, 2020, https://www.aarp.org/content/dam/aarp/ppi/2020/05/full-report-caregiving-in-the-united-states.doi.10.26419-2Fppi.00103.001.pdf and Caregiving in the U.S. 2025 and 2015, AARP and NAC.
[24] Caregiving in the U.S. 2025, 2020 and 2015, AARP and NAC.
[25] Caregiving in the U.S. 2025, AARP and NAC.
[26] Caregiving in the U.S. 2025, AARP and NAC.
[27] National Healthcare Expenditures 2022 Highlights, Centers for Medicare and Medcaid Services (CMS), December 13, 2023, https://www.cms.gov/newsroom/fact-sheets/national-health-expenditures-2022-highlights.
[27] Caregiving in the U.S. 2015, 2020, and 2025, AARP and NAC.
[29] Caregiving in the U.S. 2015, 2020, and 2025, AARP and NAC.
[30] Caregiving in the U.S. 2015 and 2025, AARP and NAC.
[31] Caregiving in the U.S. 2015, 2020, and 2025, AARP and NAC.
[32] Caregiving in the U.S. 2015, 2020, and 2025, AARP and NAC.
[33] Caregiving in the U.S. 2025, AARP and NAC.


Comments